I want to see Id- Vgs Curve

HI, I finally Modified gmsh example. thanks jaun!
but, unfortunately, i have one more question.

I want to see Id - Vgs Curve of MOSFET, and Id - Vds also.
but, i can’t find good example in internet or manual.
So, If anyone knows how to plot following graph, please let me know

Hi:

For the transfer and output curves, you can simulate your device step by step, and at the same time change the gate or drain bais accordingly. For the current, the command “get_contact_current(device=device, contact=contact, equation=ece_name)” can export the result at the contact you set. Then you can organize the data you have got and plot them in through any approach, like matplotlib in python or other visualization tools.

If you want to fit your experiment curves, you need to pay a lot of effort.

Regards,
QS.C

1 Like

I am currently working toward providing the scripts used for publication.

For now, this python function can be used to sweep the bias and save the currents at each bias point:
https://github.com/devsim/devsim/blob/r1.6.1/python_packages/ramp.py

Please note this version is newer than the one in current 1.6.0 release, and should replace the one in the python_packages directory. The rampbias function will sweep the bias and reduce the bias step if there is a convergence issue.

For example, this function will sweep the drain bias from the current bias to vd using a step of vdestep.

rampbias(device, "drain", vd, vdstep, 0.01, 25, 1e-4, 1e30, printAllCurrents)

The last argument is a callback function which can be used to store the data to a file or print to the screen. For example:

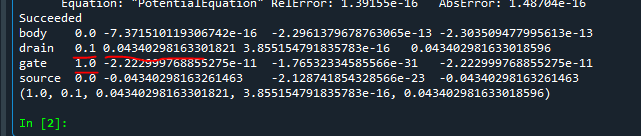
def PrintCurrents(device, contact):
    '''
       print out contact currents
    '''
    # TODO add charge
    contact_bias_name = GetContactBiasName(contact)
    electron_current= ds.get_contact_current(device=device, contact=contact, equation=ece_name)
    hole_current    = ds.get_contact_current(device=device, contact=contact, equation=hce_name)
    total_current   = electron_current + hole_current
    voltage         = ds.get_parameter(device=device, name=GetContactBiasName(contact))
    data = (voltage, electron_current, hole_current, total_current)
    print("{0}\t{1}\t{2}\t{3}\t{4}".format(contact, *data))
    return data

def printAllCurrents(device):
    '''
      Prints all contact currents on device
    '''
    for c in ds.get_contact_list(device=device):
        PrintCurrents(device, c)

If you want to do multiple sweeps, you would need to backup and restore the solution variables at the beginning of each sweep.

def save_backup():
    # we are now at the initial bias
    biases = ('drain', 'gate', 'source', 'body')
    backup = {'regions' : {},
              'contacts' : {},
      }
    for i in oxide_regions:
        backup['regions'][i] = {}
        for j in ("Potential",):
            backup['regions'][i][j] = ds.get_node_model_values(device=device, region=i, name=j)
    for i in silicon_regions:
        backup['regions'][i] = {}
        for j in ("Potential", "Electrons", "Holes"):
            backup['regions'][i][j] = ds.get_node_model_values(device=device, region=i, name=j)
    backup['biases'] = {}
    for i in biases:
        backup['biases'][GetContactBiasName(i)] = ds.get_parameter(device=device, name=GetContactBiasName(i))
    return backup

def restore_backup(backup):
    for region, solution_data in backup['regions'].items():
        for name, values in solution_data.items():
            ds.set_node_values(device=device, region=region, name=name, values=values)
    for contact_bias, value in backup['biases'].items():
        print("RESTORE %s %g" % (contact_bias, value))
        ds.set_parameter(device=device, name=contact_bias, value=value)

I hope to publish the scripts used for publication in the near future.

1 Like

Dear QsChen.
Hi, thank you for your kindness!
I got a lot of ideas because of your suggestion.
have a nice day! :slight_smile:

Hi Jaun!
I always thanks to your answer
as your suggestion, i modified ramp.py and stored Drain current & parameter in .CSV file
but, I doubt if this is a normal value. because Drain current flows even if I give a negative gate value (ex) Vgs = -0.5 [V] & Vds= 0.2 [V]
Is this device in Depletion mode MOSFET?
so, could you see my result & code? i use mobiliy/gmsh_mod2d & ramp.py
and i didn’t modify device parameter. i mean, i only varied Voltage.

I store data to .CSV file as following method

and.when i watched console, it seems to work good

@Juan
this is ramp.py which i modified!

def printAllCurrents(device):
    '''
      Prints all contact currents on device
    '''
    for c in ds.get_contact_list(device=device):
        PrintCurrents(device, c)
    StoreCurrents_csv(device)
    
def StoreCurrents_csv(device):
    '''
       store contact currents in array
    '''
    for c in ['drain']:
        #PrintCurrents(device, c)
        # TODO add charge
        contact_bias_name = GetContactBiasName(c)
        electron_current  = get_contact_current(device=device, contact=c, equation=ece_name)
        hole_current      = get_contact_current(device=device, contact=c, equation=hce_name)
        total_current     = electron_current + hole_current                                        
        Drain_voltage     = get_parameter(device=device, name=GetContactBiasName(c))
        Gate_voltage      =  get_parameter(device=device, name=GetContactBiasName('gate'))
        data = (Gate_voltage,Drain_voltage, electron_current, hole_current, total_current)
        print(data)
        with open("id_vds.csv", "a", encoding="utf-8") as ofh:
                ofh.write('%s,%s,%s,%s\n' % (c,Gate_voltage,Drain_voltage,electron_current))

and this is potential at surface in Vgs = -1 Vds = 0.2
Its potential barrier seems low, so does the Drain current flow?

Are you using the original structure and doping profile? The original device and profile were just meant for testing the simulator, and not tuned for performance.

Please look at the doping profile in the tecplot file:
write_devices(file=“gmsh_mos2d_dd.dat”, type=“tecplot”)

and make sure that the NetDoping and dimensions of the device make sense. This Doping can be modified in:
gmsh_mos2d_create.py

Once you start getting reasonable numbers, it may be necessary to use refinement to improve the mesh quality, which we can discuss further.

as your suggestion, I try to tune doping parameter such as Bulk, S/D, Poly G.
sometimes, it seems to work fine. but i want to set Vth = 0.7 V
So I searched for white paper similar to my device. and when I adjust same doping parameter in paper, it don’t work. i mean, it have a lot of body current. so i don’t know why device don’t work… Please do you help me? could you recommended Parameter?

This picture is well tuned mosfet but Vth < 0.7 (Bulk = -1e18, S/D = 4e19, gate = 1e20, Tox = 10nm)
not-bad

This is another I-V Curve (Bulk = -1e18, S/D = 4e19, gate = 1e20, Tox = 10nm)
bad

it have not good I-V Curve. and the thing is that Body current is flow

i have one more question
Is the unit of the value in the code “cm”?, i mean, 1e-6 = 1e-6 cm = 10 nm?
image

I am sorry you are having difficulty. The length unit in all of the physics files and mesh are in cm. To prevent issues with the body current flowing, it may be good to look at the substrate doping, as well as the distance of the body contact from the rest of the device.

One thing to check to see is if the body contact doping is reasonable, in gmsh_mos2d_create.py

node_model(name="BodyDoping",   device=device, region="bulk", equation="0.5*%(body_doping)1.15e*erfc(-(y-%(y_bulk_bottom)1.15e)/%(y_diffusion_decay)1.15e)" % mydict)

If you would like for me to take a look at your simulation files, please upload them as an attachment to this discussion or on github.

1 Like

thank you jaun!
Finally, I make reasonable device (Vth ~ 0.6)! THANK YOU!
I’m sorry because i still have two question… :disappointed_relieved:

  1. in drain current data, what is drain current dimension? [A] right? or [A/um]?
  2. When modify diffusion spacing in .geo & msh file, Device characteristic is changed. is it normal?
    I modify x_diffusion_spacing at surface S-O like that


    AND, I have densely spaced mesh

BUT, PROBLEM IS That TCAD analysis is abnormal. I mean, I-V Curve is changed a lot ( I Don’t modify any python code) (Vt= 0.6 Vgs = 1.0 Now)
ID=0

DO I have to modify gmsh_mos2d_create.py? i don’t know what to modify

Meshing can be difficult to control in Gmsh. One thing I suggest trying is to use refinement based on the simulation results. Then the spacing settings on the boundaries have less significance.

As I have done in:
https://github.com/devsim/devsim_misc/blob/main/refinement/gmsh_mos2d.geo

You would turn off the boundary control of the mesh spacing:

Mesh.CharacteristicLengthExtendFromBoundary = 0;
Mesh.Algorithm=5; /*Delaunay*/
//Mesh.RandomFactor=1e-5; /*perturbation*/
Mesh.CharacteristicLengthFromPoints = 0;
Mesh.CharacteristicLengthFromCurvature = 0;
Mesh.CharacteristicLengthExtendFromBoundary = 0;

and then use initial simulation results to guide refinement.

Starting from:
https://github.com/devsim/devsim_misc/tree/main/refinement

Please look at:
run2.sh
mos2d_refine2.py

for how the simulation result can be used to generate a background mesh , bgmesh2.pos, which can then be loaded into Gmsh to create the refined mesh.

If you have difficult running run2.sh, the generated commands look like this:

time gmsh -2 -format msh2 gmsh_mos2d.geo -o gmsh_mos2d2.msh
time python mos2d_refine2.py
cp gmsh_mos2d2.msh gmsh_mos2d2_0.msh
cp bgmesh2.pos bgmesh2_0.pos
cp test2.dat test2_0.dat
time gmsh -2 -format msh2 -o gmsh_mos2d2_1.msh -bgm ./bgmesh2.pos gmsh_mos2d.geo
cp gmsh_mos2d2_1.msh gmsh_mos2d2.msh
cp bgmesh2.pos bgmesh2_1.pos
cp test2.dat test2_1.dat
time python mos2d_refine2.py
time gmsh -2 -format msh2 -o gmsh_mos2d2_2.msh -bgm ./bgmesh2.pos gmsh_mos2d.geo
cp gmsh_mos2d2_2.msh gmsh_mos2d2.msh
cp bgmesh2.pos bgmesh2_2.pos
cp test2.dat test2_2.dat
time python mos2d_refine2.py
time gmsh -2 -format msh2 -o gmsh_mos2d2_3.msh -bgm ./bgmesh2.pos gmsh_mos2d.geo
cp gmsh_mos2d2_3.msh gmsh_mos2d2.msh
cp bgmesh2.pos bgmesh2_3.pos
cp test2.dat test2_3.dat
time python mos2d_refine2.py

For comparison, here is the initial mesh test2_0.dat compared to test2_3.dat.


Note for this approach, you would need to decide how many refinements would be necessary versus size of the resulting simulation.

Hello @jab2, I am glad to see your progress.

To answer your units question, for a 2D simulation, the current would be in \mathrm{A}/\mathrm{cm}.

Also, as mesh quality improves, the simulation results should not change. However, the initial meshes from Gmsh are not tailored to the doping profile. A refinement strategy, as I’ve shown above, should lead to better results.

Would you please tell me how you plot this meshed structure ?

Hi @caihng

You should be able to use the devsim.write_devices command to create a file in the Tecplot or VTK format. For the plots above I used VisIt to visualize the mesh with the Tecplot format.
https://visit-dav.github.io/visit-website/