Basic questions from a new user - Visualization of Resuls and Mesh for 1D and 2D Sims

Hi Juan,

I have a question regarding the access of the simulation result and for visualization of data.
I would like to directly visualize the data in the Python script using matplotlib or similar without having to use the external plotting software like VisIt, as given in the manual.

Based on the 1D capacitor example, plotting the Potential across the capacitor seems straight forward, accessing the x-coordinate and Potential using

get_node_model_values(device=device, region=region, name=‘x’)
and
get_node_model_values(device=device, region=region, name=‘Potential’)

and then plot the Data in what ever way desired.
same goes for the Electric FIeld, with

get_edge_model_values(device=device, region=region, name=‘ElectricFIeld’)

of course taking into account that one is now dealing with values on the edges of the mesh, rather than on the node.

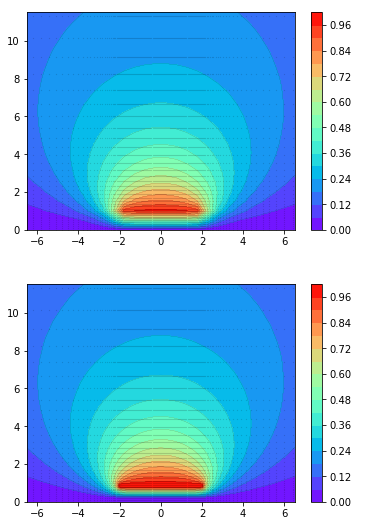
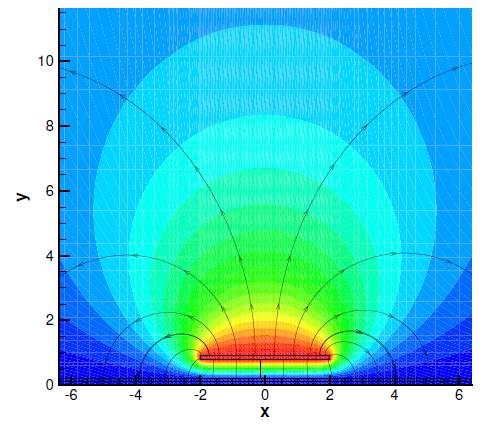
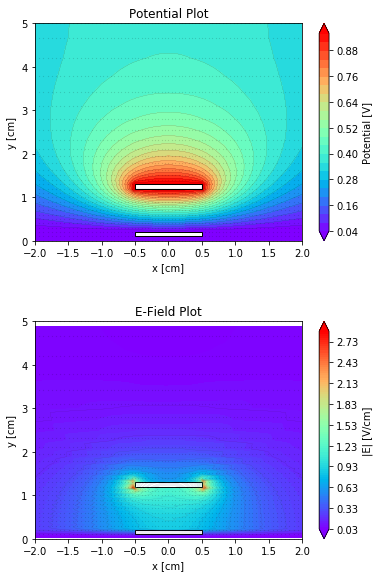
My question now is how to deal with accessing e.g. the Potential in case of the 2D capacitor example, as shown in Figure 16.1 in the Manual? This should of course by 2D data, but if I use

get_node_model_values(device=device, region=region, name=‘Potential’)

after running the 2D capacitor example, the result seems to be a 1D array.

What am I doing wrong?

Furthermore: is there a way to obtain the mesh layout directly in Python for plotting?

Thank you for your help!

You can use the write_devices command:
https://devsim.net/CommandReference.html#devsim.write_devices

To save the data in the tecplot or vtk format. I usually use the tecplot format in the open source plotting software VisIt:
https://visit-dav.github.io/visit-website/

Both formats can be used with VisIt or Paraview. I have had the best luck with the Tecplot output with VisIt. The 2D capacitor figure was created in Tecplot with the Tecplot format, but I no longer have a license.

If you create your own output format, you can use this command:
https://devsim.net/CommandReference.html#devsim.get_element_node_list

to get the nodes for the elements in each region and use that to get the x, y, and z values.

1 Like

Also, if you look in examples/diode/diode_1d.py, there is some commented out code for plotting current densities and electric field at the mid point of each mesh edge.

For edge-based quantities in 2D (current, electric field), you would need to use a command like:
element_from_edge_model

to convert the scalar quanties into vector edge quantities on element edges and average them onto either the nodes or the triangle center.

Alternatively, there are the vector_element_model and vector_gradient commands, but they are less applicable.

Hi Juan,

thank you for your answers!
I am not sure if I understand it correctly, or maybe I phrased my question not clearly enough.
In the diode_1d example, you obtain the data to plot by using the get_edge_model_values() function - and all looks fine. It also works for the 1d capacitor example, both for get_edge_model_values() and get_node_model_values().

For the 2D capacitor example, however, if I want to access the potential using get_node_model_values(device=device, region=region, name=‘Potential’), I only get an array with 8281 entries (which is the number of nodes in x and y direction).

Why is that not a 8281x8281 matrix, so two dimensional data in x and y? If I plot the results with Visit after using write_device(), the Potential data is 2D, so it must be somewhere?

In 2D, the software works with unstructured triangular meshes. Since the built-in mesher does use non-terminating mesh lines, you could use something like numpy.meshgrid to interpolate the values onto a grid for visualization in matplotlib. It would just require doing a unique sort of the coordinates positions in the x and y direction. This would not work as well if you used Gmsh to create a mesh whose triangles are randomly oriented.

For the general case, it looks like matplotlib is able to work with irregularly spaced data.
https://matplotlib.org/stable/gallery/images_contours_and_fields/irregulardatagrid.html

It should be possible to get the existing triangulation from the simulator using devsim.get_element_node_list, so that the data would not need to be triangulated again in matplotlib.

Hello Juan,

thank you for your advice and the matplotlib related link - plotting the 2D potential from the nodes is then straight forward.

In case someone is interested in the Python code, the following assumes the running of the 2D capacitor example prior to execution of the code:

import matplotlib.pyplot as plt
import matplotlib.tri as tri
import numpy as np

ngridx = 100 # define grid points in x
ngridy = 100 # define grid points in y
xi = np.linspace(xmin, xmax, ngridx) # Set grid x-value based on x-distances defined by the project
yi = np.linspace(ymin, ymax, ngridy) # Set grid y-value based on y-distances defined by the project
Xi, Yi = np.meshgrid(xi, yi) # define the grid

x = np.array(get_node_model_values(device=device, region=region, name=‘x’)) # get x-node values
y = np.array(get_node_model_values(device=device, region=region, name=‘y’)) # get y-node values
potential = np.array(get_node_model_values(device=device, region=region, name=‘Potential’)) # get the potential data

triang = tri.Triangulation(x, y) # triangulate the x y data points
interpolator = tri.LinearTriInterpolator(triang, potential)
potential_i = interpolator(Xi, Yi) # interpolate the potential data on the defined grid

– Plot the triangulated Data from above –
fig, ax1 = plt.subplots()
ax1.contour(Xi, Yi, potential_i, levels=18, linewidths=0.1, colors=‘k’)
cntr1 = ax1.contourf(Xi, Yi, potential_i, levels=18, cmap=“rainbow”)
fig.colorbar(cntr1, ax=ax1)
ax1.plot(x_test, y_test, ‘ko’, ms=0.2) # This adds the mesh’s nodes to the plot as well
ax1.set(xlim=(-6.5, 6.5), ylim=(0, 11.5))

– Plot the Data with matplotslib internal triangulation function –
fig, ax = plt.subplots()
ax.tricontour(x, y, potential, levels=18, linewidths=0.1, colors=‘k’)
cntr = ax.tricontourf(x, y, potential, levels=18, cmap=“rainbow”)
fig.colorbar(cntr, ax=ax)
ax.plot(x, y, ‘ko’, ms=0.2)
ax.set(xlim=(-6.5, 6.5), ylim=(0, 11.5))
plt.show()


The resulting colorplot of both variants are similar to the one shown in the manual.
The second plot variant can be used if one is just interested in the plot.
The first plot variant gives access to the interpolated potential data for further use.

Comparison from the manual:

image


Thank you for help Juan!

1 Like

I also tried to use the triangulation via devsim.get_element_node_list as you mentioned -
however I did not understand what data it provides and I could not get any further information with the help of the manual.

Sorry for this basic question, but are the three columns provided by devsim.get_element_node_list the nodes belonging to the respective triangle?

Furthermore - I am still looking for a way of displaying the Electric Field Strength in a similar fashion to the potential above, i. e. by interpolating it on the mesh.
Since, if I understand correctly, the ElectricField is defined on the element edges, my first approach would be to simply get the “center” of each edge as defined by the unitx and unity - edge vectors and the edge-lengths and set the respective ElectricField value from the simulation at this point (and then once again interpolate for plotting etc).

To do that, I would however need to locate the respective edges in the grid - can you tell me a way to do that?
Are they maybe in a specific order when called with devsim.get_edge_model_values() so that each 3 entries belong to one triangle element or something like that, and one could think about following all edges across all nodes from the coordinate system’s origin or something similar?

Thank you very much.

In 2D, you will get tuples from get_element_node_list, which will give you 3 node indexes for each triangle in the mesh. You can use these to index into the “x” and “y” arrays to get the positions of each triangle vertex. Having these node indexes would help to reuse the triangulation from the simulator into matplotlib to use the triangulation from the simulation.

There are three types of models:

  • Node models
  • Edge models (connecting two nodes)
  • Element Edge models (3 belonging to a triangle)

There is more information about the approach in the manual as well as here:
https://www.techrxiv.org/articles/preprint/Element_Edge_Based_Discretization_for_TCAD_Device_Simulation/14129081

ElectricField is an Edge Model and is only a scalar value of the ElectricField projected in the direction of the Edge. It is possible to get the x and y components of the ElectricField for a triangular element by using an Element Edge Model, using a command like:

devsim.element_from_edge_model(device=device, region=region, edge_model="ElectricField")

This will create 2 element edge models named:

  • ElectricField_x
  • ElectricField_y

By the nature of how the electric field is calculated, it is constant over the entire triangle. You could use devsim.get_element_model_values to get these components for each triangle edge. The returned list is 3 times the number of elements and the ordering of the values is:

  • Element 0 Edge 0
  • Element 0 Edge 1
  • Element 0 Edge 2
  • Element 1 Edge 0
  • Element 1 Edge 1
  • Element 1 Edge 2
  • . . .
  • Element N-1 Edge 0
  • Element N-1 Edge 1
  • Element N-1 Edge 2

So the length of these values lists are 3 times the length of the list returned by:
devsim.get_element_node_list()

By the nature of how Electric Field is determined from Potential, the 3 values on each element returned for get_element_model_values should be identical.

This means that you could take every 3rd value of ElectricField_x, and ElectricField_y, and they could be considered the electric field over each corresponding triangle. So in matplotlib, you could assign a value for the components of the electric field at the center of every triangle in your device. You just need to calculate the center of each triangle to give the data an x and y position. The circumcenter of a triangle would be a good position, and can be readily calculated by the three points.

Hi Juan,

sorry for not writing for quite some time but I could only now find time to work more on the project I am planning to do with devsim.

Thanks for your latest answer, that helped a lot! I followed your advice using get_element_model_values and assigned the E-Field values for each triangle to a center point of said triangle (it’s not exactly the circumcenter yet, but close enough for the first tests) and then did the triangulation with matplotlib as explained above.

If someone is interested, here is the potential and the E-field for a 2D plate capacitor with 1 cm plate distance and 1 cm plate extension in x-direction:

The E-Field at the center of the capacitor is the expected 1 V/cm.

I have one more question regarding circular symmetry, I will post it in a new thread.

Hi @SinglePhotonGuy ,

Thanks for sharing your results. I think this can be very useful for those wanting to use matplotlib. Please let me know if you need any additional features in devsim. For one thing, it might be useful if the program provided the circumcenter coordinates.

Hi @Juan,

Thank you!
I think it would benefit devsim greatly if the direct visualization possibilities of matplotlib or other packages could be easily accessed directly in Python. The circumcenter for element-based values is a good idea as a starting point, like you said. As you pointed out, it is already accessible in Python with the data provided and a bit of math, but since it is a general feature to visualize any kind of element based-data, it would be worth giving it its own function to return it I think.

Another feature that I would find useful is a quicker access of structural properties, for instance a quick way to visualize the whole mesh as fully-drawn triangle elements as well as visualizing triangles of specific defined regions, to get a quick feedback, if the set up device is correctly modeled.
Basically a grid-file that is returned for each project. I mean all the necessary data is there, one would just need to connect the nodes for the specific regions, it can also be done post-sim in Python

Those are just some ideas so far, I will try to do this kind of visualization with my current version of devsim in Python and see how it goes.

It could also be beneficial for new usuers to give it a dedicated chapter in the devsim manual once it is in good chape, maybe as a part of “Getting started”? I am also happy to contribute something, since I basically had the “new user” experience just now (however, my experience and knowledge is still limited of course)

Hi @SinglePhotonGuy ,

Thank you for the suggestions. If you are interested in the circumcenters, please create a feature request on github, so it can be tracked.

The documentation is open for improvement. If you are interested, please see:
GitHub - devsim/devsim_documentation: Documentation for DEVSIM